
Selecting Periodic and Hotspots… will display the main Crime Analysis dialog:
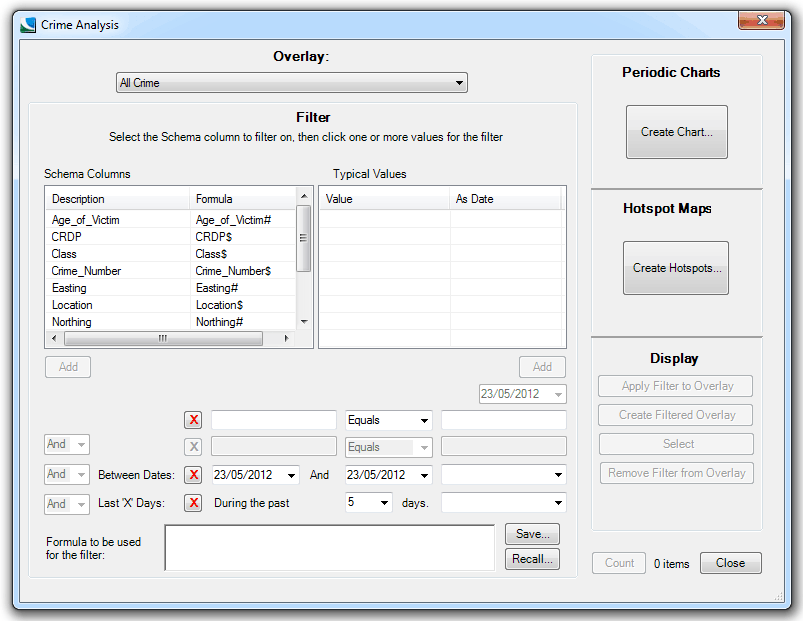
The functionality of the Crime AnalySIS toolkit depends upon there being a suitable map displayed, containing one or more overlays of crime data. As a minimum, the data should hold an attribute on each item designating the date and time and at least one attribute designating the type of crime and other relevant information.
Date and time can be Date@, String$, Floating Point# or Integer& data types. Note there is no time component in the Integer& data type.
See Periodic Charts and Hotspot Maps for a full description of these functions.
Send comments on this topic.
Click to return to www.cadcorp.com
© Copyright 2000-2017 Computer Aided Development Corporation Limited (Cadcorp).